Triad Demand Forecast
Using this data source, the user is able to display the Triad Demand as forecast (in MWh), for a selected period of time. The data for this data source is taken from Elexon. The Triad refers to the three half-hour settlement periods with highest system demand between November and February, separated by at least ten clear days. Please note: further information about what is included for each data source is available in the Data Source matrix and in the Glossary of terms used in widgets.
The data source user setting to be selected for the widget is the Demand Forecast Triad Type.
Choose from the drop-down menu, see below:
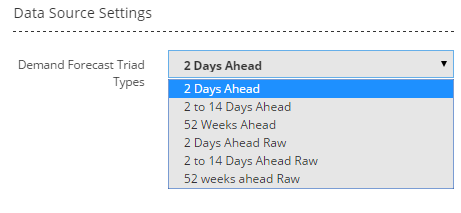
2 Days Ahead: will display a single demand forecast for the 2 Days Ahead period.
2 to 14 Days Ahead: will display a single demand forecast for the 2 to 14 Days Ahead period.
52 Weeks Ahead: will display three single demand forecasts for the 52 weeks ahead period.
2 Days Ahead Raw: will display a demand forecast for each half-hour period in the 2 Days Ahead period.
2 to 14 Days Ahead Raw: will display a single demand forecast for each day in the 2 to 14 Days Ahead period.
52 Weeks Ahead Raw: will display a single demand forecast for each Triad week in the 52 weeks ahead period.
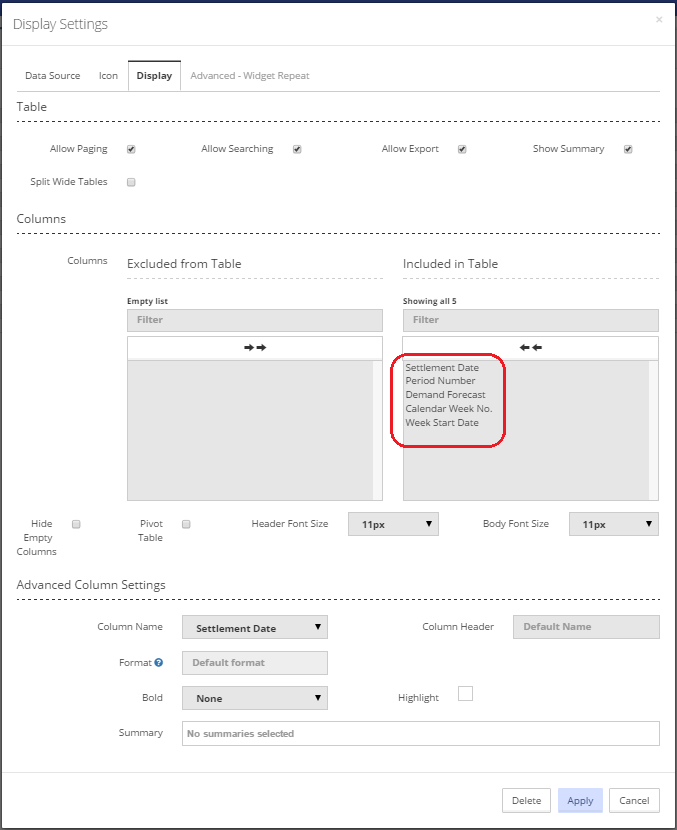
Having selected the appropriate user settings for the widget, the information to be displayed in the widget is then selected by navigating to the 'Display' tab on the 'Display Settings' pop-up screen.
For a widget using a data source of ‘Triad Demand Forecast’, the list of information available for display is shown in the screen shot below (for a table widget - similar information will be available for a chart widget).
The listed items will be displayed in the widget, and those displayed will depend on the Demand Forecast Triad Type that has been selected at the data source setting step. See Display for more information on selecting the items for your widget.
Created with the Personal Edition of HelpNDoc: Full-featured EPub generator