Gas Hourly Forecast Comparison
Using this data source, the user is able to display Gas Hourly Forecast Comparison Information over a selected period of time. Please note: further information about what is included for each data source is available in the Data Source matrix and in the Glossary of terms used in widgets.
The data source user setting to be selected for the widget is the Period.
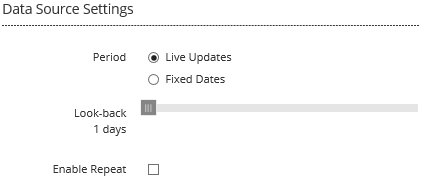
Period allows you to choose between two options, Live Updates and Fixed Dates
Selecting Live Updates displays a slider allowing you to select your Look-back period, from 1 - 7 days look-back (see below):
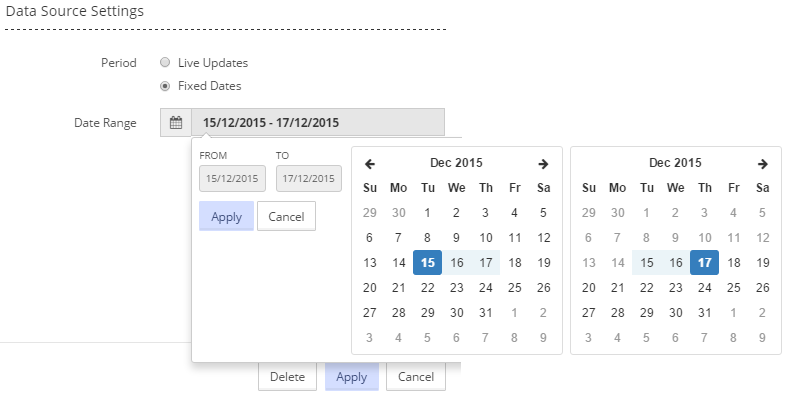
Selecting Fixed Dates displays a date range in the 'Date Range' line. Click on the dates, choose from the calendar displayed, and click Apply (see below). Having selected dates, your widget will display data within the date range that you have specified.
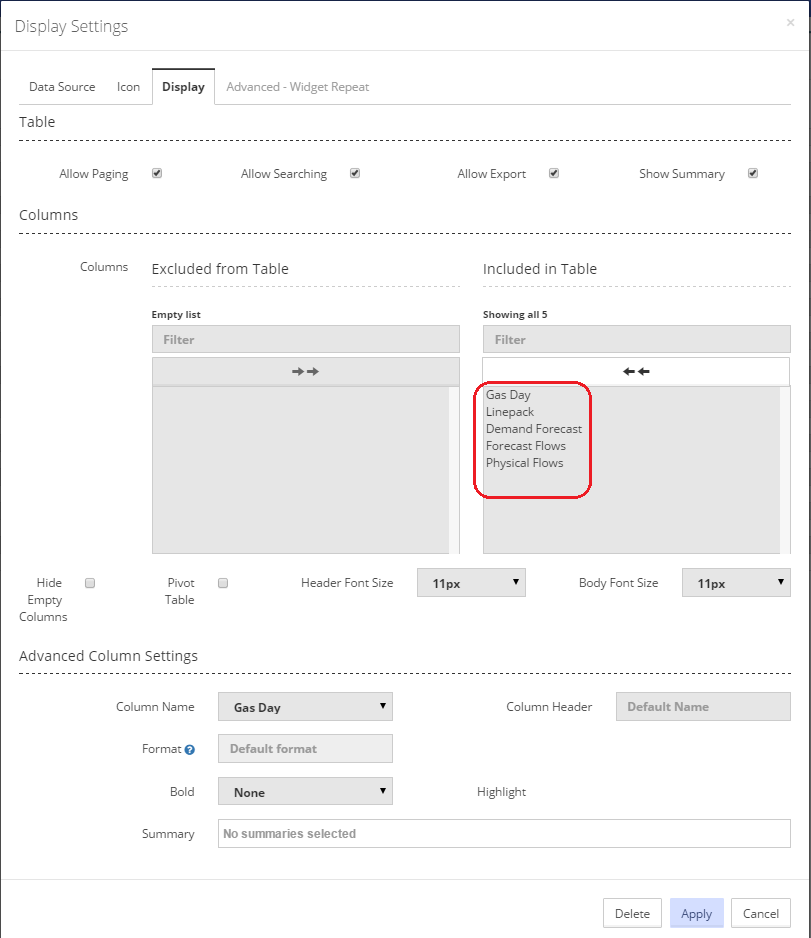
Having selected the appropriate user settings for the widget, the information to be displayed in the widget is then selected by navigating to the 'Display' tab on the 'Display Settings' pop-up screen.
For a widget using a data source of ‘Gas Hourly Forecast Comparison’, the list of information available for display is shown in the screen shot below (for a table widget - similar information will be available for a chart widget).
Any or all of the listed items can be displayed in the widget. See Display for more information on selecting the items for your widget.
Created with the Personal Edition of HelpNDoc: Easy CHM and documentation editor