Net Imbalance Volume Forecast
Using this data source, the user is able to display Net Imbalance Volume Forecast information over a selected period of time. Please note: further information about what is included for each data source is available in the Data Source matrix and in the Glossary of terms used in widgets.
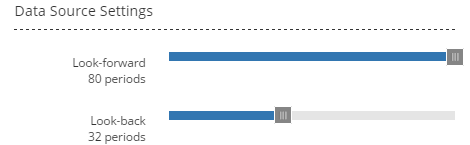
The data source user settings to be selected for the widget are the Look-forward and Look-back periods.
Using the slider, select from 0 - 80 periods Look-forward and from 0 - 80 periods Look-back (see below):
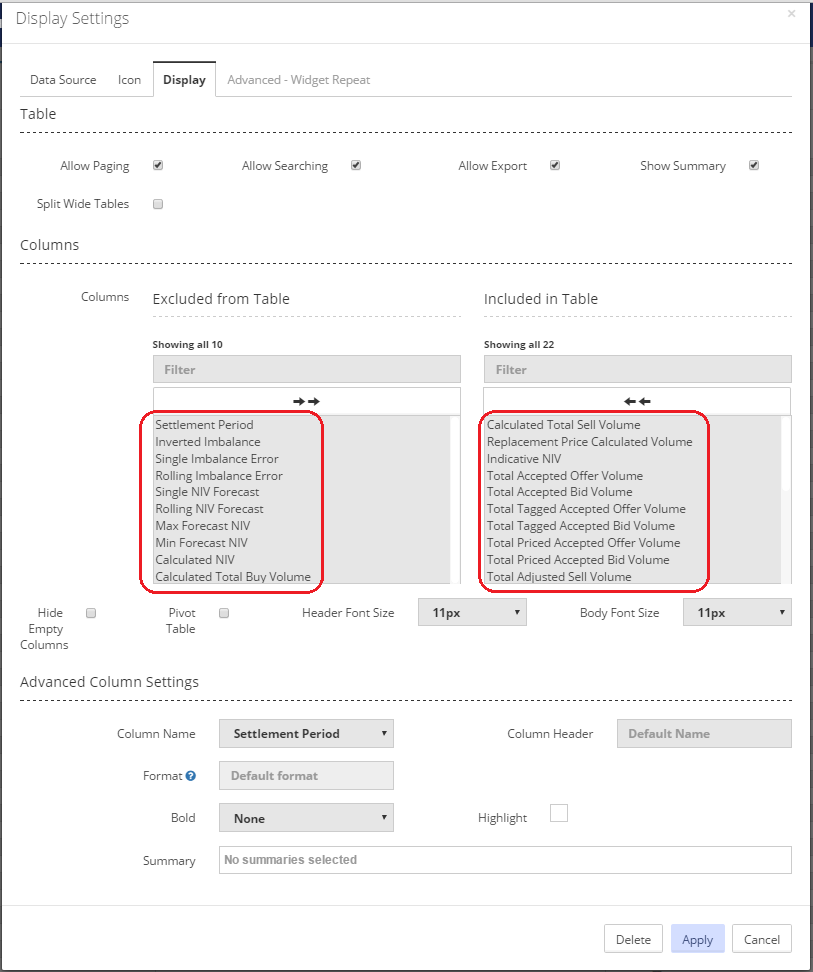
Having selected the appropriate user settings for the widget, the information to be displayed in the widget is then selected by navigating to the 'Display' tab on the 'Display Settings' pop-up screen.
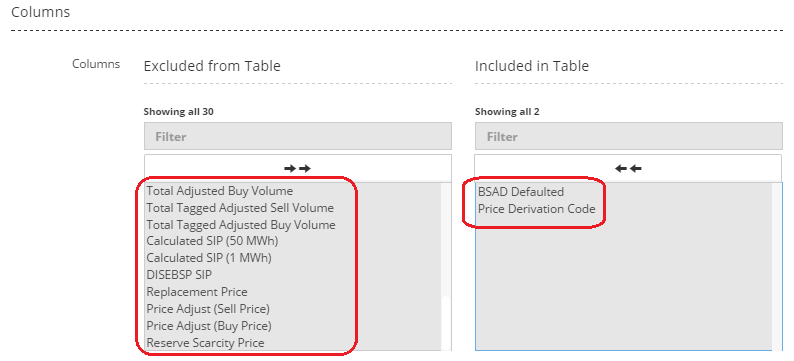
For a widget using a data source of ‘Net Imbalance Volume Forecast’, the list of information available for display is shown in the screen shot below (for a table widget - similar information will be available for a chart widget); scroll down for remaining items on the list as shown in the further screen shot below.
Any or all of the listed items can be displayed in the widget. See Display for more information on selecting the items for your widget.
Created with the Personal Edition of HelpNDoc: Single source CHM, PDF, DOC and HTML Help creation