SO142 Account Period Data by BMU
Using this data source, the user is able to display SO142 Account Period Data by BMU over a selected period of time. Please note: further information about what is included for each data source is available in the Data Source matrix and in the Glossary of terms used in widgets.
The data source settings to be selected include:
For the Chart Y-values aggregation select from No Aggregation, Sum, Average, Min and Max. Having selected to create a table, please choose ‘No Aggregation’ from this list.
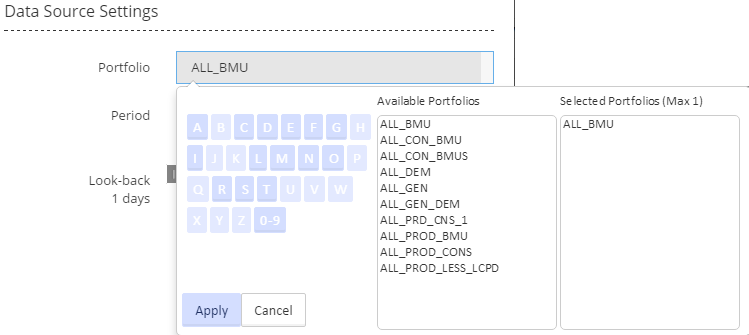
To select a Portfolio, click in the box to display a keypad and two columns, one column displays available portfolios and the other your selected portfolio. Click on a letter from the keypad to display all portfolios beginning with that letter. Click on the relevant portfolio from the list displayed and the portfolio will appear in the Selected Portfolios list. Click on apply to confirm your choice.
Please note that only one portfolio can be selected at any one time.
Select periods allows you to choose a range for dates, including associated periods, for the widget. A period equals a half hour segment of the day.
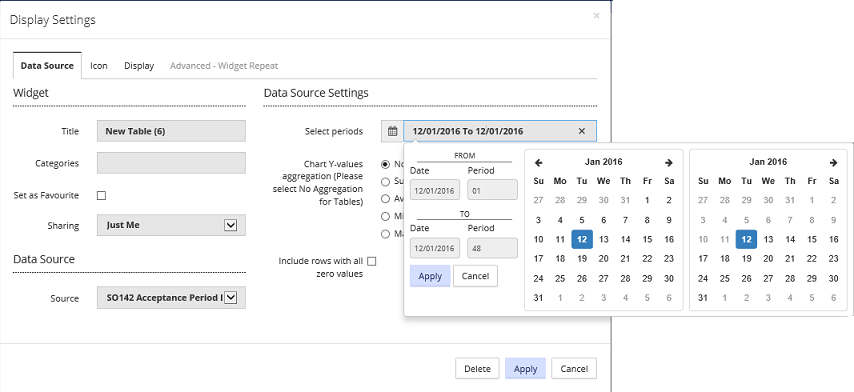
Click on the displayed dates in the ‘Select periods’ line, choose dates and then periods from the calendar displayed for each of the ‘from’ and ‘to’ dates, and click  (see below). Once you have clicked on a date, the periods for that date will be automatically displayed - hover over the period number to display the start time of that period (see second screen shot below). Click on the period number to select that period. Click
  to close the calendar selection box.
Having selected a date and period range, your widget will display data within the date and period range that you have specified.
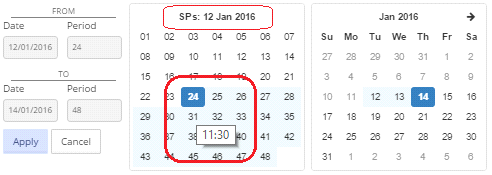
For example, having selected the start (’from’) date of 12/01/2016, the periods for that day are displayed. Hovering the mouse over period number 24 shows the period start time of 11.30am, see below:
If you would like to include rows which only include zero values, click in the box displayed below the ‘Chart Y-values’ list.
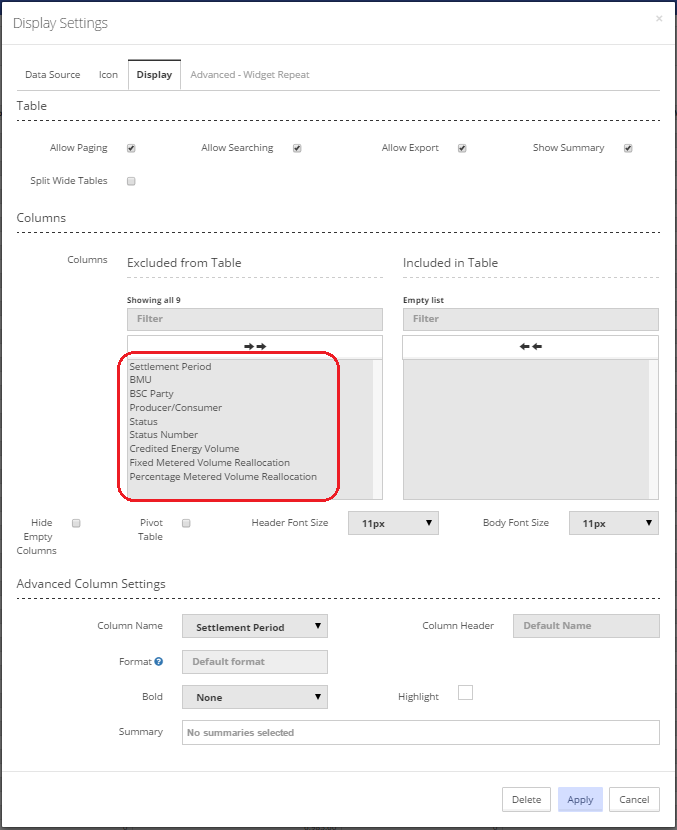
Having selected the appropriate user settings for the widget, the information to be displayed in the widget is then selected by navigating to the 'Display' tab on the 'Display Settings' pop-up screen.
For a widget using a data source of ‘SO142 Account Period Data by BMU’, the list of information available for display is shown in the screen shot below (for a table widget - similar information will be available for a chart widget).
Any or all of the listed items can be displayed in the widget. See Display for more information on selecting the items for your widget.
Created with the Personal Edition of HelpNDoc: Easy EBook and documentation generator