The Display tab for a chart allows you to add, amend and delete information for your widget. Please see each relevant 'Data Source' entry within the Selecting A Data Source section for a list of the items that may be available for display. Please note: further information about what is included for each data source is available in the Data Source matrix and in the Glossary of terms used in widgets.
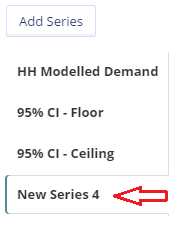
Click  to display the series data settings for a new series.
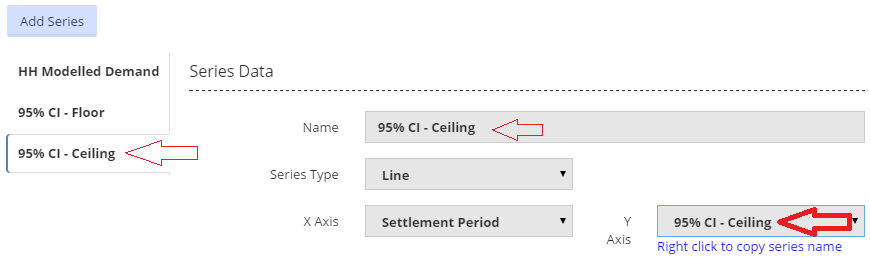
Series Data
The information available from the drop down menus for the X and Y Axes is determined by the data source chosen from the Data Source menu.
Begin your selection process with the Y Axis in the Series Data section. Select from the Y Axis drop down menu and right click to copy this selection into the series name box. This will also be reflected in the series tab on the left hand side of the pop-up screen.
As a each new series is added a new tab will be displayed.
Series Type - to characterise the display, select between Line and Bar from the drop down menu.
X Axis - select from the drop down menu. The menu will display information relevant to the data source chosen.
Appearance
Colour - click on the coloured square to view a selection of colours to choose from.
Line Thickness - click on the sliding square to select a line thickness.
Point Size - this refers to the size of the marker points displayed on the chart.
Hidden On Open - when the box is checked, this series data will not be displayed when the widget is first opened.
Allow Gaps - when the box is checked, the chart will display any gaps in the data provided.
Fill Series – when the box is checked, the chart will be filled with the line colour below the displayed line for that series.
Steps – when the box is checked, the displayed line for that series will be shown as a series of steps rather than one continuous line
Axes

Check the box to automatically set the minimum value for your Y Axis. Alternatively, enter your chosen value into the box marked Min.

Check the box to automatically set the maximum value for your Y Axis. Alternatively, enter your chosen value into the box marked Max.
Click the  button to delete this series information from the widget.
Created with the Personal Edition of HelpNDoc: Easily create PDF Help documents