2-14 Days Demand Forecast
When the data source is set to ‘2-14 Days Demand Forecast’, the user is able to display a half hourly demand forecast for POWER over the selected period, for a chosen forecast option. Please note: further information about what is included for each data source is available in the Data Source matrix and in the Glossary of terms used in widgets.
The data source user settings to be selected for the widget are the Forecast Type, and Period.
Forecast Type: select your forecast type from NDF or TSDF.
NDF – National Demand Forecast
TSDF - Transmission System Demand Forecast
Period allows you to choose between two options, Live Updates and Fixed Periods.
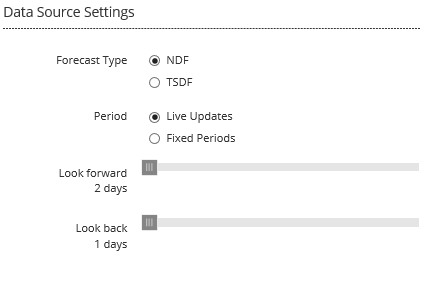
Selecting Live Updates displays a slider allowing you to select your Look-forward and Look-back periods, from 2 -14 days look forward and from 1 - 7 days look back (see below):
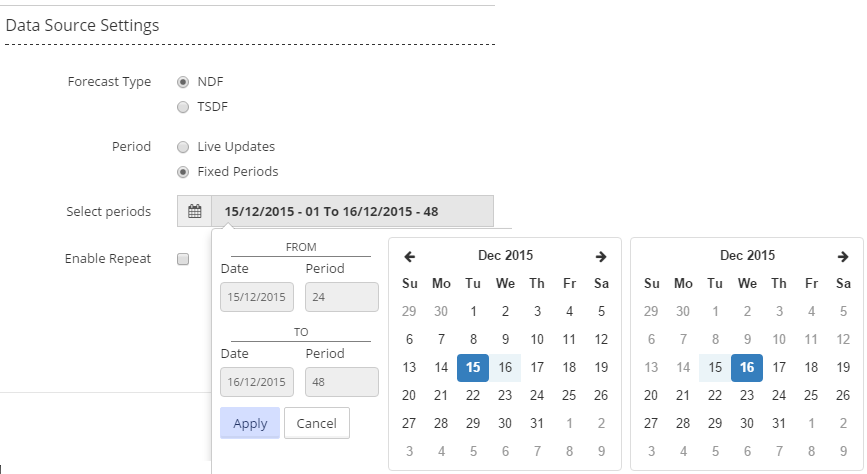
Selecting Fixed Periods allows you to choose a range for dates, including associated periods, for the widget. A period equals a half hour segment of the day.
Click on the displayed dates in the ‘Select periods’ line, choose dates and then periods from the calendar displayed for each of the ‘from’ and ‘to’ dates, and click  (see below). Once you have clicked on a date, the periods for that date will be automatically displayed - hover over the period number to display the start time of that period (see second screen shot below). Click on the period number to select that period. Click
  to close the calendar selection box.
Having selected a date and period range, your widget will display data within the date and period range that you have specified.
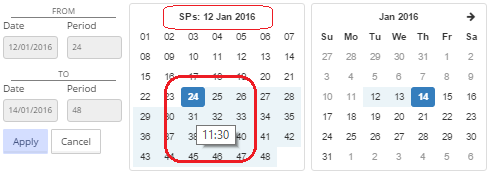
For example, having selected the start (’from’) date of 12/01/2016, the periods for that day are displayed. Hovering the mouse over period number 24 shows the period start time of 11.30am, see below:
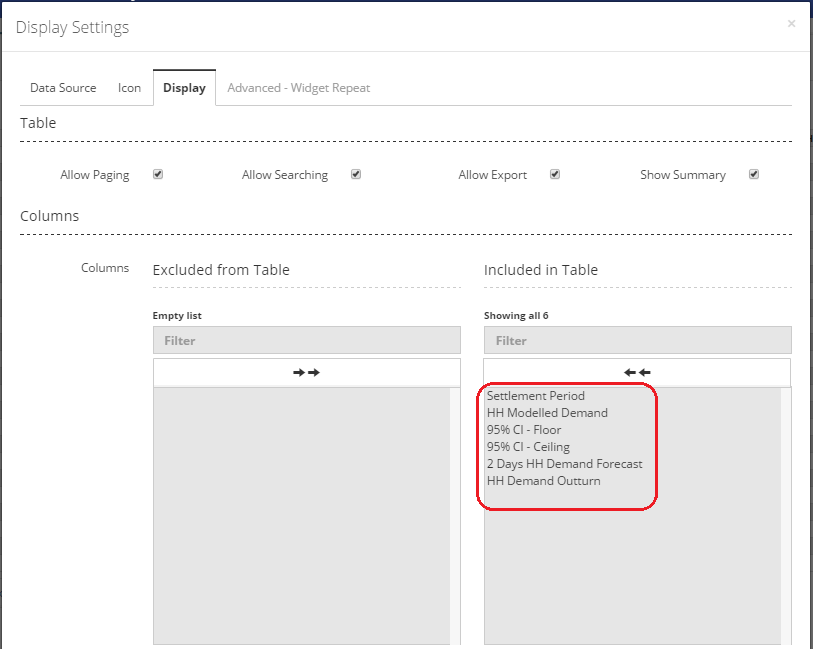
Having selected the appropriate user settings for the widget, the information to be displayed in the widget is then selected by navigating to the 'Display' tab on the 'Display Settings' pop-up screen.
For a widget using a data source of ‘2-14 Days Demand Forecast’, the list of information available for display is shown in the screen shot below (for a table widget - similar information will be available for a chart widget).
Any or all of the listed items can be displayed in the widget. See Display for more information on selecting the items for your widget.
Created with the Personal Edition of HelpNDoc: Easily create PDF Help documents